Comparison between Frequecy, Wavelength & Time period

FREQUENCY, WAVELENGTH & TIME PERIOD

In general, frequency, wavelength & time period are quite confusing parameters. Indeed, these three are entirely different in nature.

FREQUENCY

Frequency is the number of occurrences of a repeating event per unit time. Unit of frequency is hertz(hz).

WAVELENGTH

Wavelength is the distance between identical points in the adjacent cycles of a waveform signal propagated in space or along a wire. Unit of wavelength is meter(m).

TIME PERIOD

The time taken to complete one full cycle is said to be time period. Unit of time period is meter/second (ms).

EXAMPLE

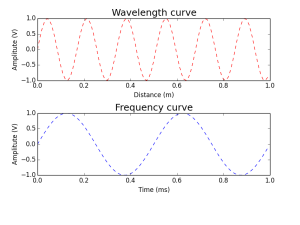
Lets take a signal at 2 kHz. Then the period is 0.5 ms. To plot this as a function of time.If a sound wave is travelling in space with a speed of 340 m/s then the wavelength is the distance the sound will travel in a period 340 * 0.5m = 17 cm. (i.e) 0.17m

PYTHON CODE

import numpy as n

import matplotlib.pyplot as p

f = 2

y = .17

d =n.arange(0,1,0.01)

t=n.arange(0,1,0.01)

wavelength =n.sin(2*n.pi/y*d)

frequency =n.sin(2*n.pi*f*t)

p.subplot(211)

p.plot(t, wavelength,’r–‘)

p.xlabel(‘Distance (m)’)

p.ylabel(‘Amplitute (V)’)

p.title(‘Wavelength curve’, fontsize=18)

p.subplot(212)

p.plot(d,frequency,’b–‘)

p.xlabel(‘Time (ms)’)

p.ylabel(‘Amplitute (V)’)

p.title(‘Frequency curve’, fontsize=18)

p.show(block=False)

WAVEFORM

figure_1

Cartesian Coordinate System

Scratch cartesian circle_s pdf

To draw a circle using Cartesian coordinate system

1.

ccs

2.


pythagoreantheorem

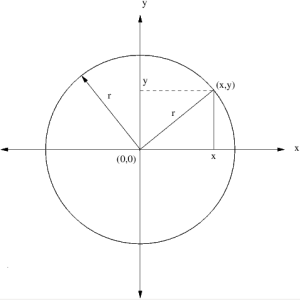
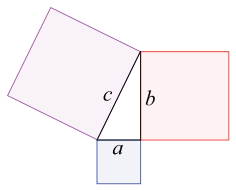
A Cartesian coordinate system is a coordinate system that specifies each point uniquely in a plane by a pair of numerical coordinates. Considering two points x and y on the x-axis and y-axis which meet at (x,y), this produces a right angle triangle with base of length x and height y. Here we could implement Pythagorean theorem which states ; The sum of the areas of the two squares on the legs (a and b) equals the area of the square on the hypotenuse (c). now applying to the above fig we get.

x,ywhere ‘r’ denotes the radius of the circle, which can be drawn by keeping either x or y a constant and varying the others value.

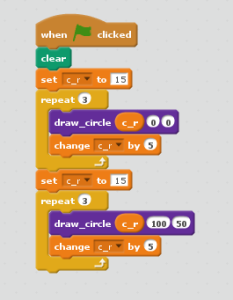
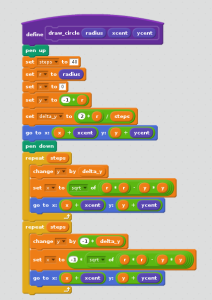
To run the script ;                                                                         Script ;

scScreenshotofcode

  • the step are defined to 40.
  • setting radius of the circle to r
  • defining x position to 0
  • defining y position to -r ( i.e.. To start the circle from the point (0,-r))
  • determines the centre of x and y.Pen down starts to draw
  • the first loop repeats for the number of steps i.e..40
  • y value is changed with respect to delta of y .
  • x is set to the modified equation of circle i.e.. x= √(r*r) – (y*y)
  • this draws only a semi circle starting from the point (0,-r) to the point (0,r)
  • hence we require a second loop to draw the other half of the semi circle.
  • the second loop repeats for the number of steps ie.40
  • y value is changed with respect to delta of – y.
  • y is set to the modified equation of circle i.e.. x= – √ (r*r) – (y*y)
  • this draws only a semi circle starting from the point (0,r) to the point (0,-r)
  • hence the other half of the semi circle is dawn.

Now this whole script is user defined to perform 3 concentric circles around each points (0,0) and (100,50)

The Drawn Circles;

 screenshotoutput

reference : http://en.wikipedia.org – image 2