Trigonometry is the branch of mathematics that deals with the relationship between ratios of the sides of a right-angled triangle with its angles.
Trigonometric Functions
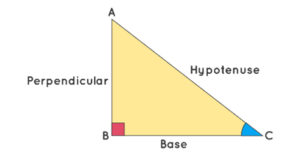
There are six basic trigonometric functions used in Trigonometry. These functions are trigonometric ratios. The six basic trigonometric functions are sine function, cosine function, secant function, co-secant function, tangent function, and co-tangent function. The trigonometric functions and identities are the ratio of sides of a right-angled triangle. The sides of a right triangle are the perpendicular side, hypotenuse, and base, which are used to calculate the sine, cosine, tangent, secant, cosecant, and cotangent values using trigonometric formulas.
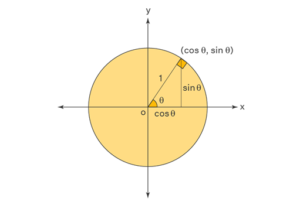
Unit Circle and Trigonometric Values
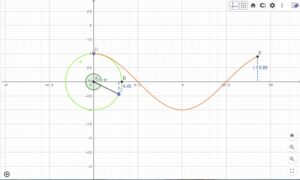
Unit circle can be used to calculate the values of basic trigonometric functions- sine, cosine, and tangent. The following diagram shows how trigonometric ratios sine and cosine can be represented in a unit circle.
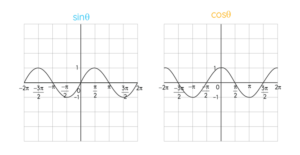
Trigonometric Functions Graph
The graphs of trigonometric functions have the domain value of θ represented on the horizontal x-axis and the range value represented along the vertical y-axis. The graph of Sinθ passes through the origin and the graph of Cosθ does not pass through the origin. The range of Sinθ and Cosθ is limited to [-1, 1].
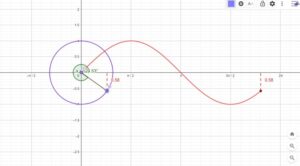
Let’s see the practical execution of the trigonometric function graphs of Sinθ and Cosθ using GeoGebra.
Steps for trigonometric function graphs of Sinθ:
- Plot two points A and B and draw a unit circle (radius=1cm).
- Mark a point C on the circle and measure angle BAC. Rename the angle as a.
- Change the settings of the x-axis by giving the distance as π/2.
- Draw a line segment between points A and C.
- Now give the input as Segment (C, (x(C),0)).
- A line drawn from C to the x-axis and point C changes with the angle change can be seen.
- Now click on settings and change the line style and colour.
- Now give input as f(x)=sin(x),0<=x<=a.
- A sine wave has drawn as per the given range can be seen.
- Now plot a point on the curve end D.
- Now, to see the change between 0 degrees to 360 degrees, give the input a Dynamic coordinate (D, a, y(C)).
- We can see the graph is drawn for every change in angle of BAC and a sine function graph simultaneously.
- Random point E appears along with the curve.
- Now give the input as Segment (E, (x(E),0)).
- Now click on settings and change the line style and colour.
- By clicking on the animation icon, the desired output can be visualized.
The figure shows the sine wave obtained using GeoGebra. It can be observed that the graph of Sinθ passes through the origin.
https://www.geogebra.org/classic/cdkf3rme
Steps for trigonometric function graph of Cosθ:
- Plot two points A and B and draw a unit circle (radius=1cm).
- Mark a point C on the circle and measure angle BAC. Rename the angle as a.
- Change the settings of the x-axis by giving the distance as π/2.
- Draw a line segment between points A and C.
- Now give the input as Segment (C, (x(C),0)).
- A line drawn from C to the x-axis and point C changes with the angle change can be seen.
- Now click on settings and change the line style and colour.
- Now give input as f(x)=Cos(x),0<=x<=a.
- A sine wave has drawn as per the given range can be seen.
- Now plot a point on the curve end D.
- Now, to see the change between 0 degrees to 360 degrees, give the input a Dynamic coordinate (D, a, y(C)).
- We can see the graph is drawn for every change in angle of BAC and a sine function graph simultaneously.
- Random point E appears along with the curve.
- Now give the input as Segment (E, (x(E),0)).
- Now click on settings and change the line style and colour.
- By clicking on the animation icon, the desired output can be visualized.
The figure shows the Cosine wave obtained using GeoGebra. It can be observed that the graph of Cosθ does not pass through the origin.
https://www.geogebra.org/classic/bcqtxcjr
Author
prathap7618@gmail.com
Related Posts
A Day of Energy, Exploration, and Learning at STEM Land
-Vaishnavi Rishi Valley School Visit on 22 January On 22nd January, STEM Land welcomed students from Rishi Valley School. The group consisted...
Read out all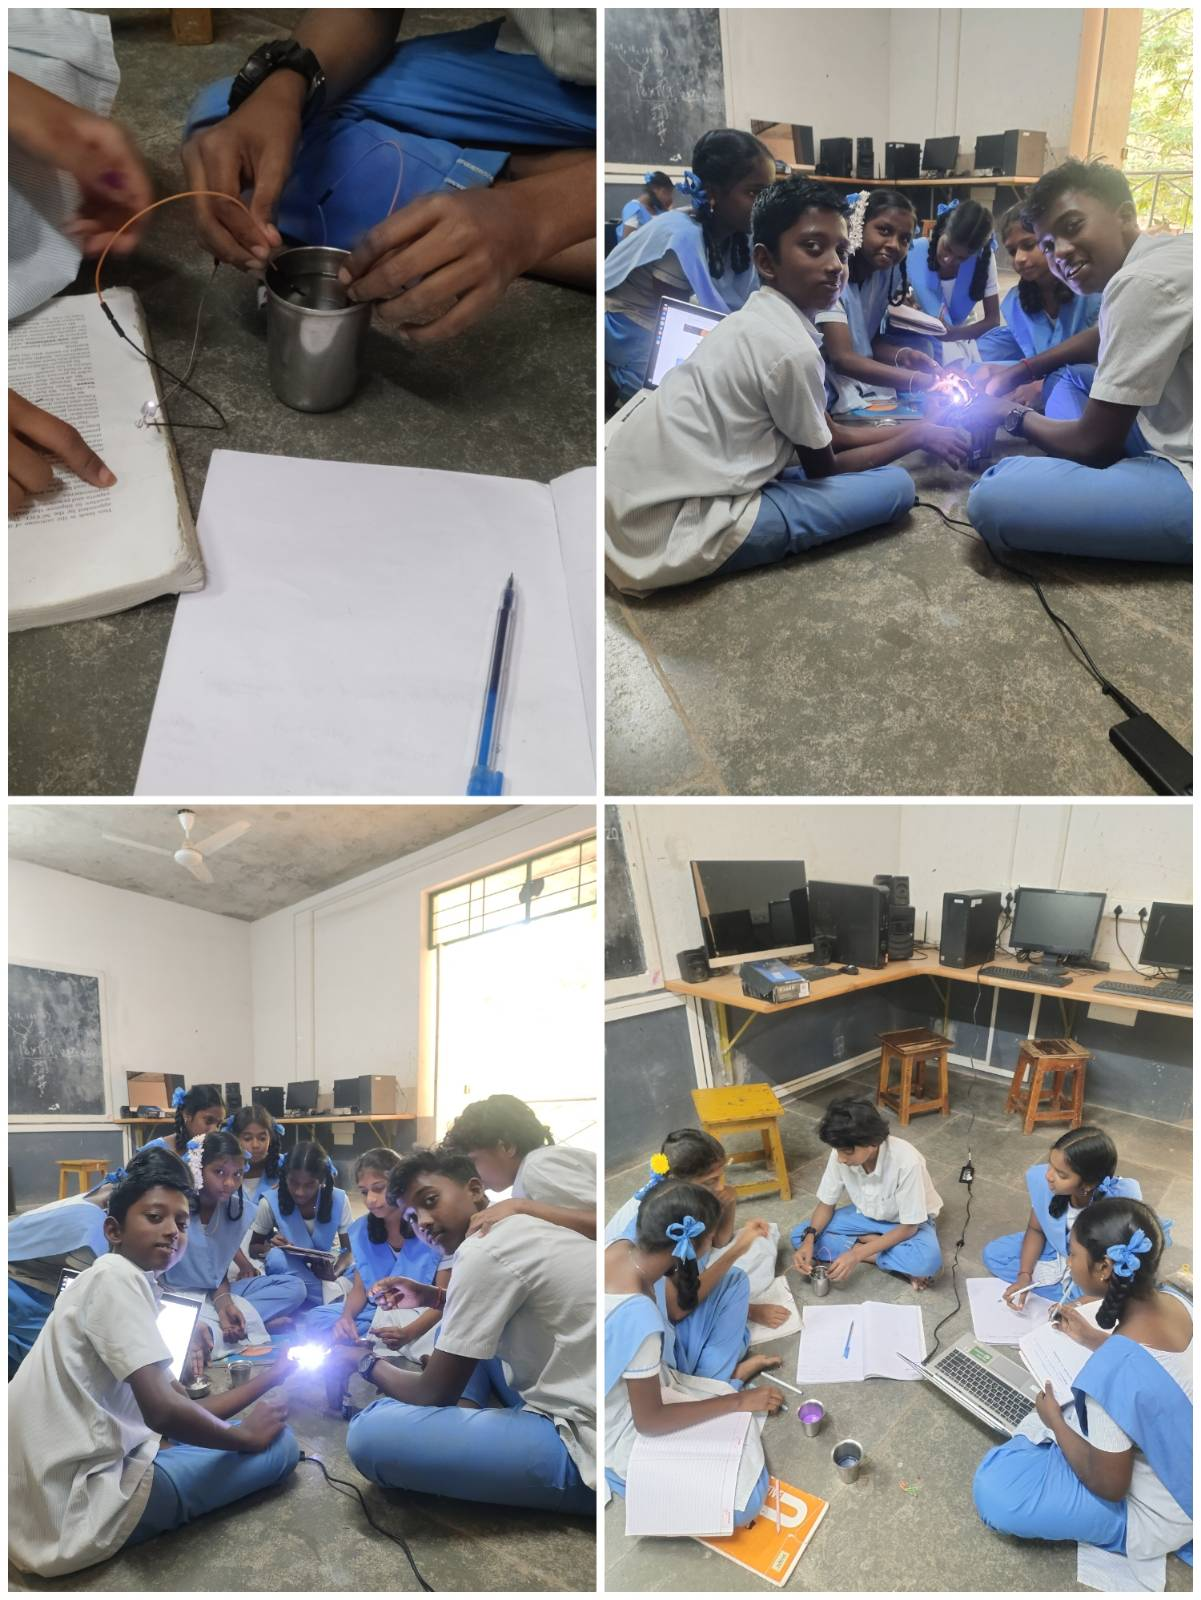
Do All Liquids Conduct Electricity? A Classroom Moment of Wonder
-Vaishnavi “Yes, Akka… all liquids conduct electricity!” That was the confident reply I received when I asked my students a simple question....
Read out all
5th Graders Share Their Talents at STEMland’s 10th Anniversary
-SandhiyaBala My Name is Sandhiya Bala, and I deeply care about Courage, care, and Happiness for myself and others. I was teaching...
Read out all
Exploring Awareness Through the Body (ATB) – A Teacher’s Journey
-SandhiyaBala, SivaguruPrasath and Nithya Santhosh SAIIER Teachers’ Centre recently invited teachers to a three-day workshop series called ATB for Teachers, held on...
Read out all
Bhishma Hunt program
The Bhishma Hunt program, organized by Sanvi Educational and Charitable Trust at Sanvi International School, invited STEM Land to lead robotics and...
Read out all
Saturday, Sanfort School Activity
-Ilakiya, Sivasankar, Ajai, NithyaSandhosh Every week, around 25 students from Sanfort International School will visit STEMLand to explore STEM activities. The school...
Read out all