Area of circle:
The area of a circle is the region covered or enclosed within its boundary. It is measured in square units. The area covered by one complete cycle of the radius of the circle on a two-dimensional plane is the area of that circle.
Area of circle formula:
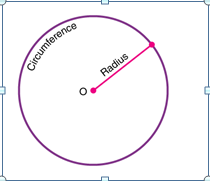
Let us take a circle with a radius r from the center ‘o’ to the boundary of the circle. Then the area for this circle, A, is equal to the product of pi and the square of the radius. It is given by;
Area of a Circle, A = πr2 square units
Here, the value of pi, π = 22/7 or 3.14, and r is the radius.
Deriving the area of the circle:
The area of a circle can be visualized & proved using two methods, namely
- Determining the circle’s area using rectangles.
- Determining the circle’s area using triangles.
Using the area of a rectangle:
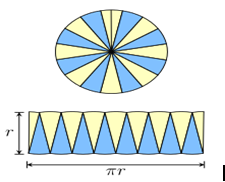
The circle is divided into equal sectors, and the sectors are arranged as shown in fig. 3. The area of the circle will be equal to that of the parallelogram-shaped figure formed by the sectors cut out from the circle. Since the sectors have equal areas, each sector will have an equal arc length. The blue coloured sectors will contribute to half of the circumference, and the yellow-coloured sectors will contribute to the other half. If the number of sectors cut from the circle is increased, the parallelogram will eventually look like a rectangle with length equal to πr and breadth equal to r.
The area of a rectangle (A) will also be the area of a circle. So, we have
- A = π×r×r
- A = πr2
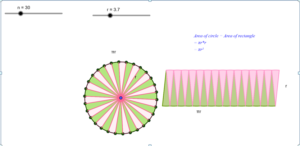
Let’s see the practical execution of the area of the circle using the derivatives of the rectangle in GeoGebra.
Step 1: By using a slider operation, create a number slider (n) with the following values.
- Set Min – 1; Max- 100 and increment as 1.
Step 2: By using a slider operation, create a radius slider (r) with the following values.
- Set Min – 4; Max- 10 and increment as 0.1.
Step 3: Plot a point A and draw a circle with radius r by keeping A as the center.
Step 4: Plot a point B anywhere on the circle.
Step 5: Give input as Rotate (B,360°/n, A).
Step 6: Now point B’ appears.
Step 7: Draw a segment between B and B’.
Step 8: Plot the midpoint C and draw a segment connecting the center and point C.
Step 9: Give the following set of inputs:
- List1=Sequence (Rotate(B,j(360°)/n,A),j,0,n).
- List2=Sequence (circularsector (A, Element (List1, j), Element (List1,j+1)),j,1,n,2).
- List3=Sequence (circularsector (A, Element (List1, j), Element (List1,j+1)),j,2,n,2).
- List4=Sequence(circularsector((jf,0), (jf+f/2,g)(jf+(-f)/2,g))),j,0,n/2-1).
- List5=Sequence (circularsector((jf+f/2,g),(jf+0,0),(jf+f,0))),j,0,n/2-1).
Step 10: Now we can observe the sectors getting formed and listed as per the input.
Step 11: Colour the sectors accordingly and insert the text for the area of the rectangle.
Step 12: By moving the number slider we observe the desired output. i.e., Area thus formed by the sectors forms a rectangle.
Author
prathap7618@gmail.com
Related Posts
Seeing and Documenting a New Narrative: Connecting RTL and The Satvic Revolution
-Saranya I stand for equality and happiness for myself and others. Reading The Satvic Revolution became more than just reading a book....
Read out allSetting up Physics laboratory in NESS school.
-SriBhavani As part our volunteer work with schools, this year we have started supporting Higher Secondary grades in NESS school. I started...
Read out allBeyond Job Descriptions: Building a Culture of Shared Stewardship
-Tamil and Sandhiya Saravanan Beyond Specialization Most organizations are designed around specialization. There is an accountant to manage finances, an HR professional...
Read out all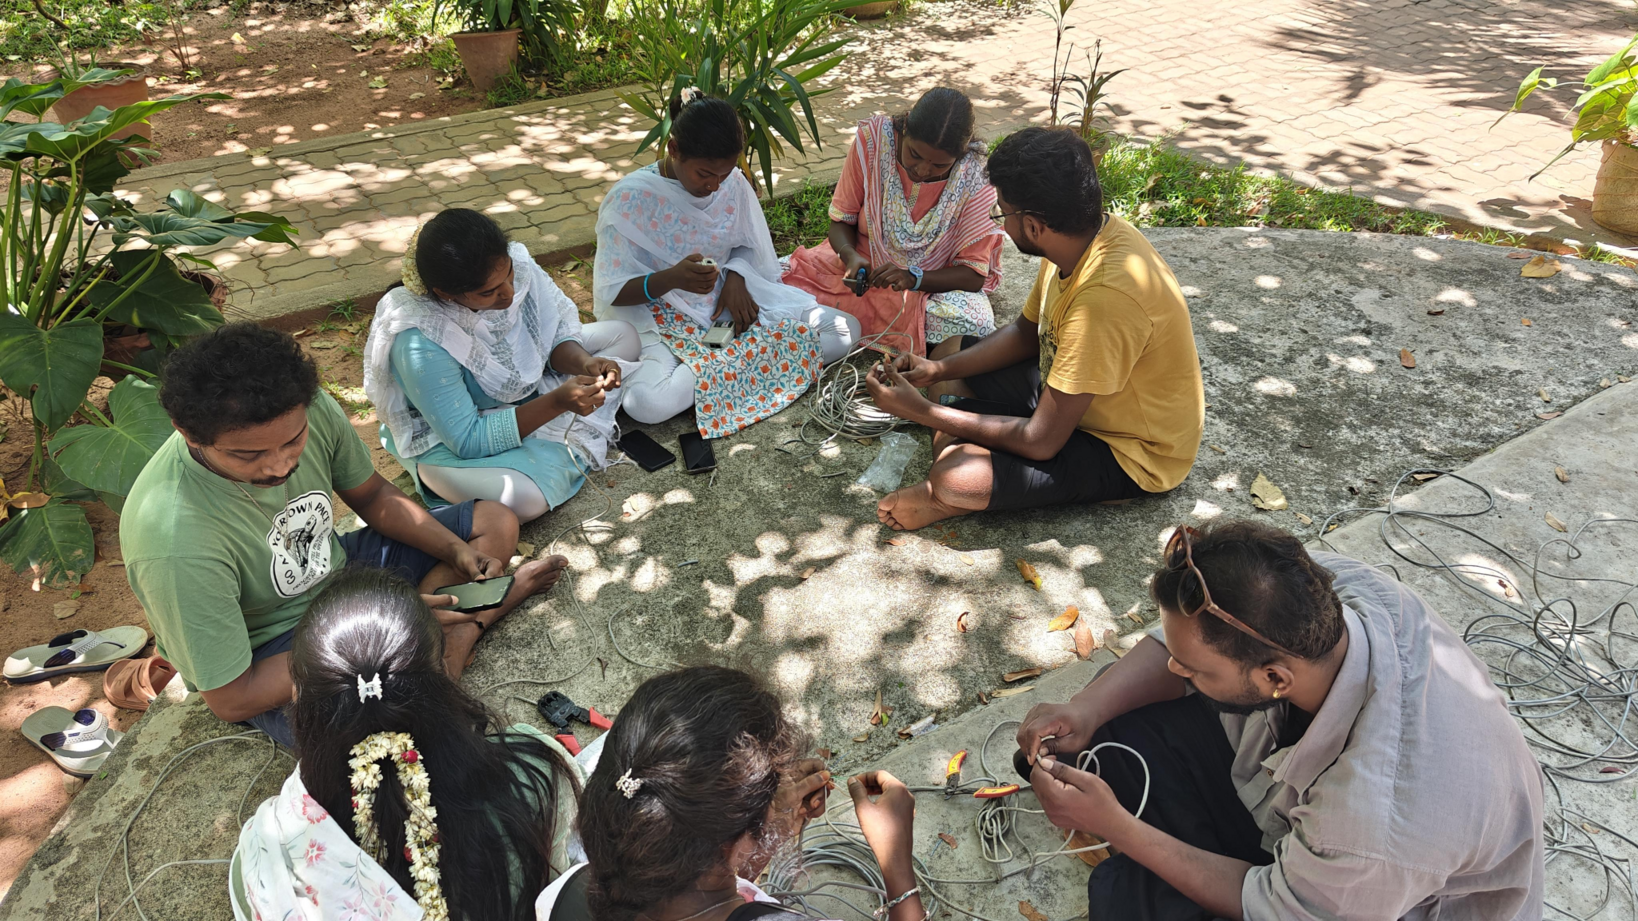
Learning Ethernet Crimping Through Peer Learning at NESS School
-Vaishnavi, Poongzhali, Atchudhan, Arunkumar, Aarthi, Nithya Sandhosh, Preethi P, Ajay On 19th May, we from STEM Land visited NESS School for Ethernet...
Read out allOur Satvic Shift – From Living Habitually to Living Intentionally
– Prathap, Siva guru Prasath, Soundharya, Saranya, JayaBharathy, Poonguzhali, ArunKumar, Rajesh, SandhiyaSaravanan, Tamil, Ajay I, Vaishnavi, Preethi P, Abinaya, Kamal, Angeline Praisy,...
Read out all
A Day of Energy, Exploration, and Learning at STEM Land
-Vaishnavi Rishi Valley School Visit on 22 January On 22nd January, STEM Land welcomed students from Rishi Valley School. The group consisted...
Read out all