~ Poovizhi
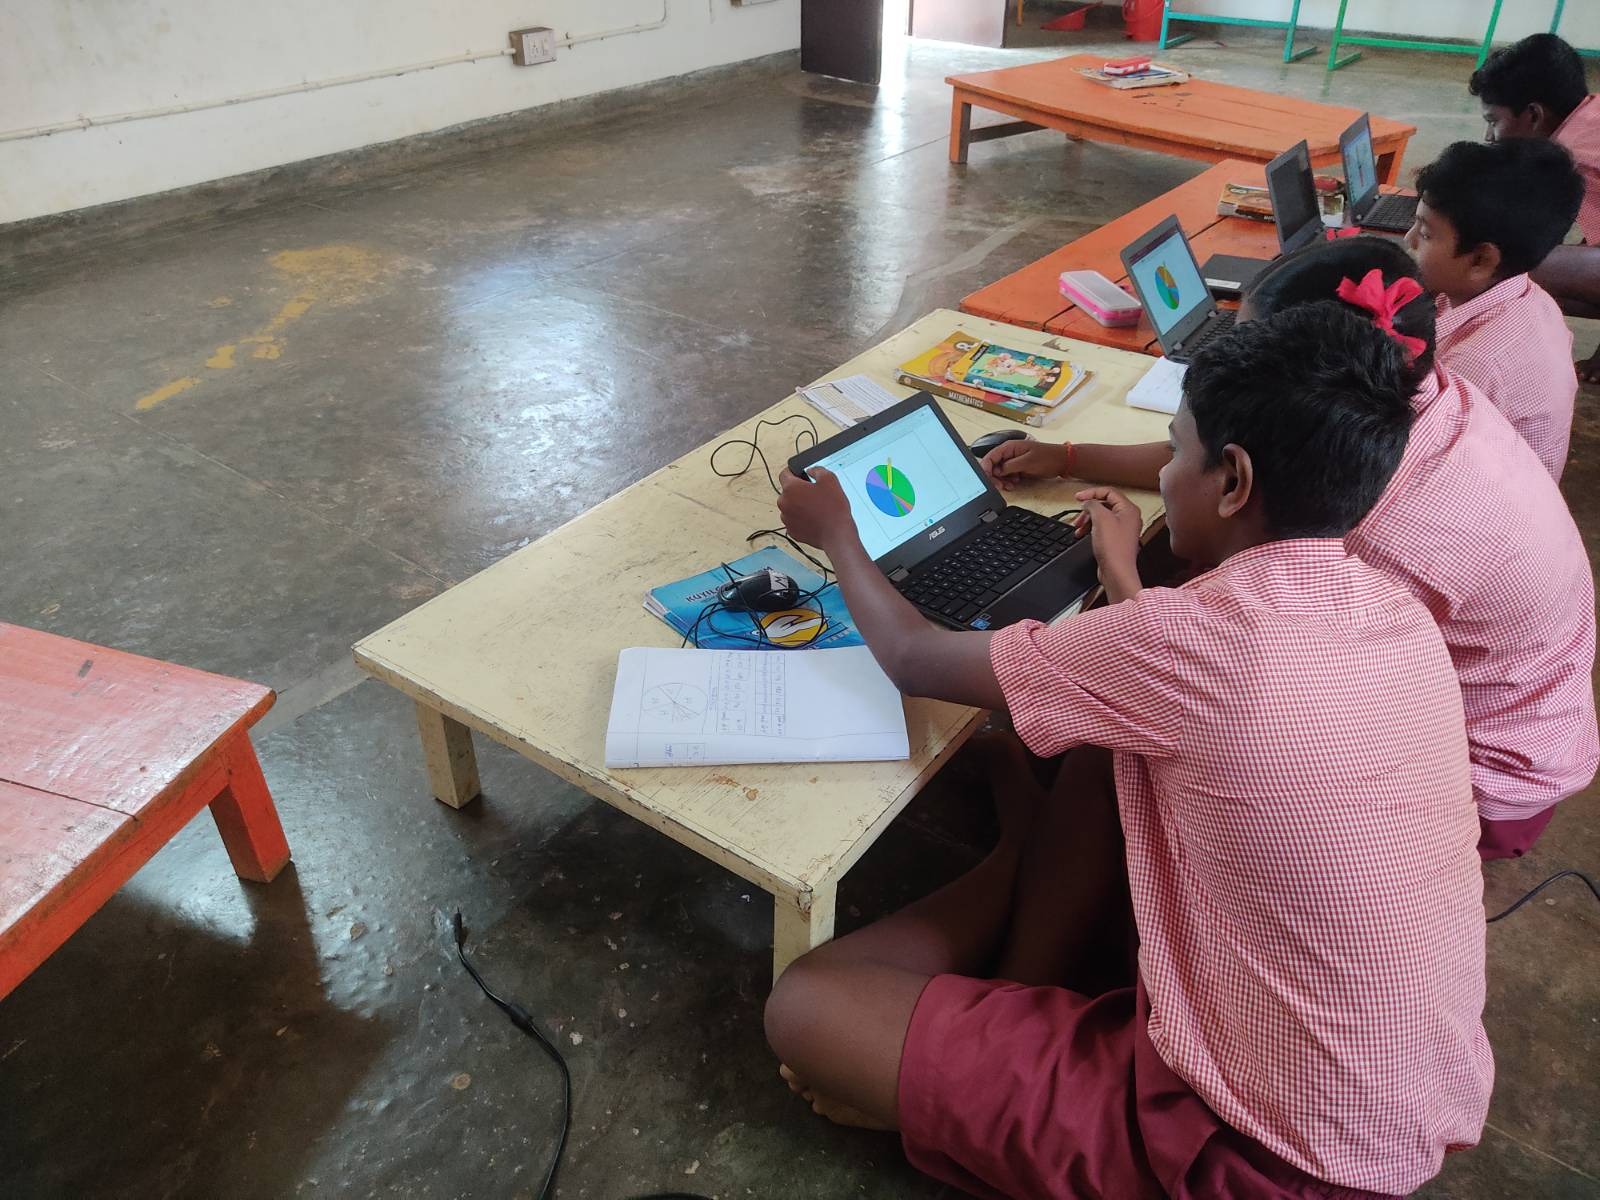
8th grade students in Udavi are learning pie chart. In C3STREAM land we
have a system where we enter teachers notes everyday and will receive
feedback on the same from Sanjeev at the end of the week. From his
feedback I learnt that I can ask children to draw pie chart for their
daily activity. I asked them to collect data on their daily activities
for 24 hours to create a visual representation of their time management.
Students began by recording their activities throughout the day, by
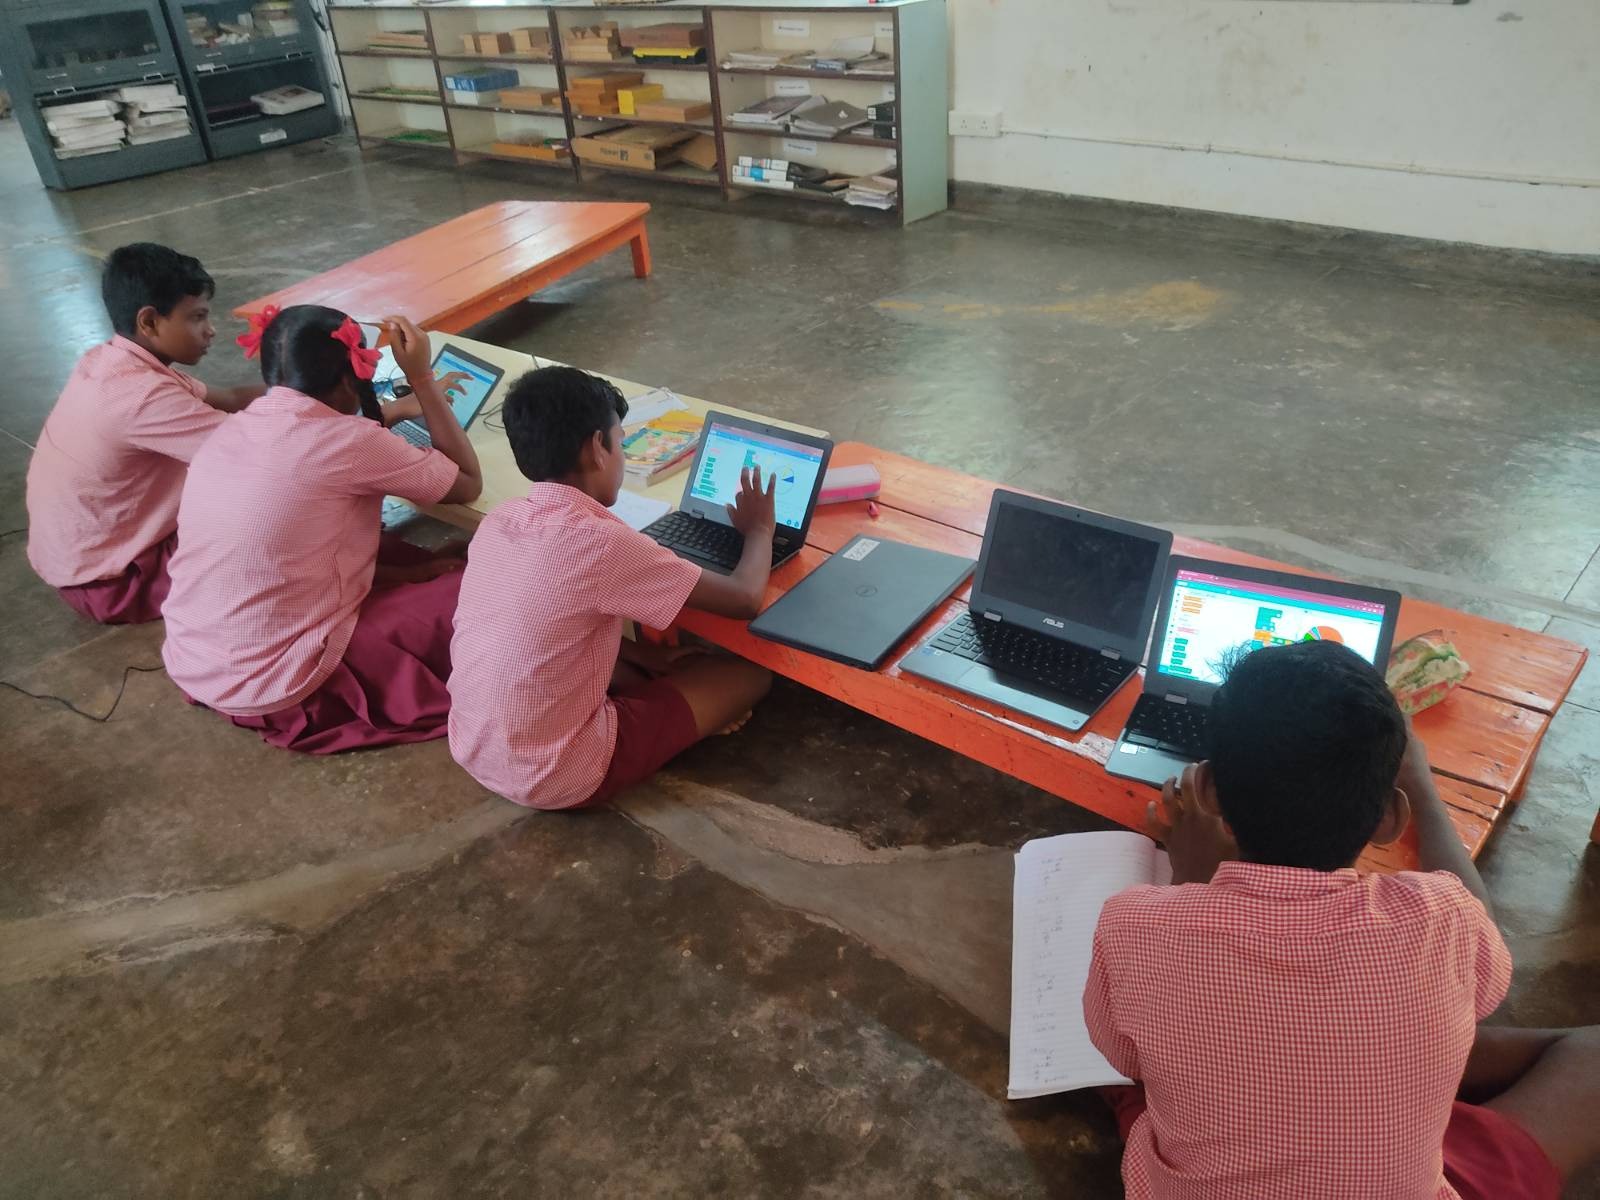
writing them down on their notebook. They then organized the data into
categories, such as sleeping, eating, studying, traveling, and leisure time.
After categorizing the data, students calculated the percentage of time
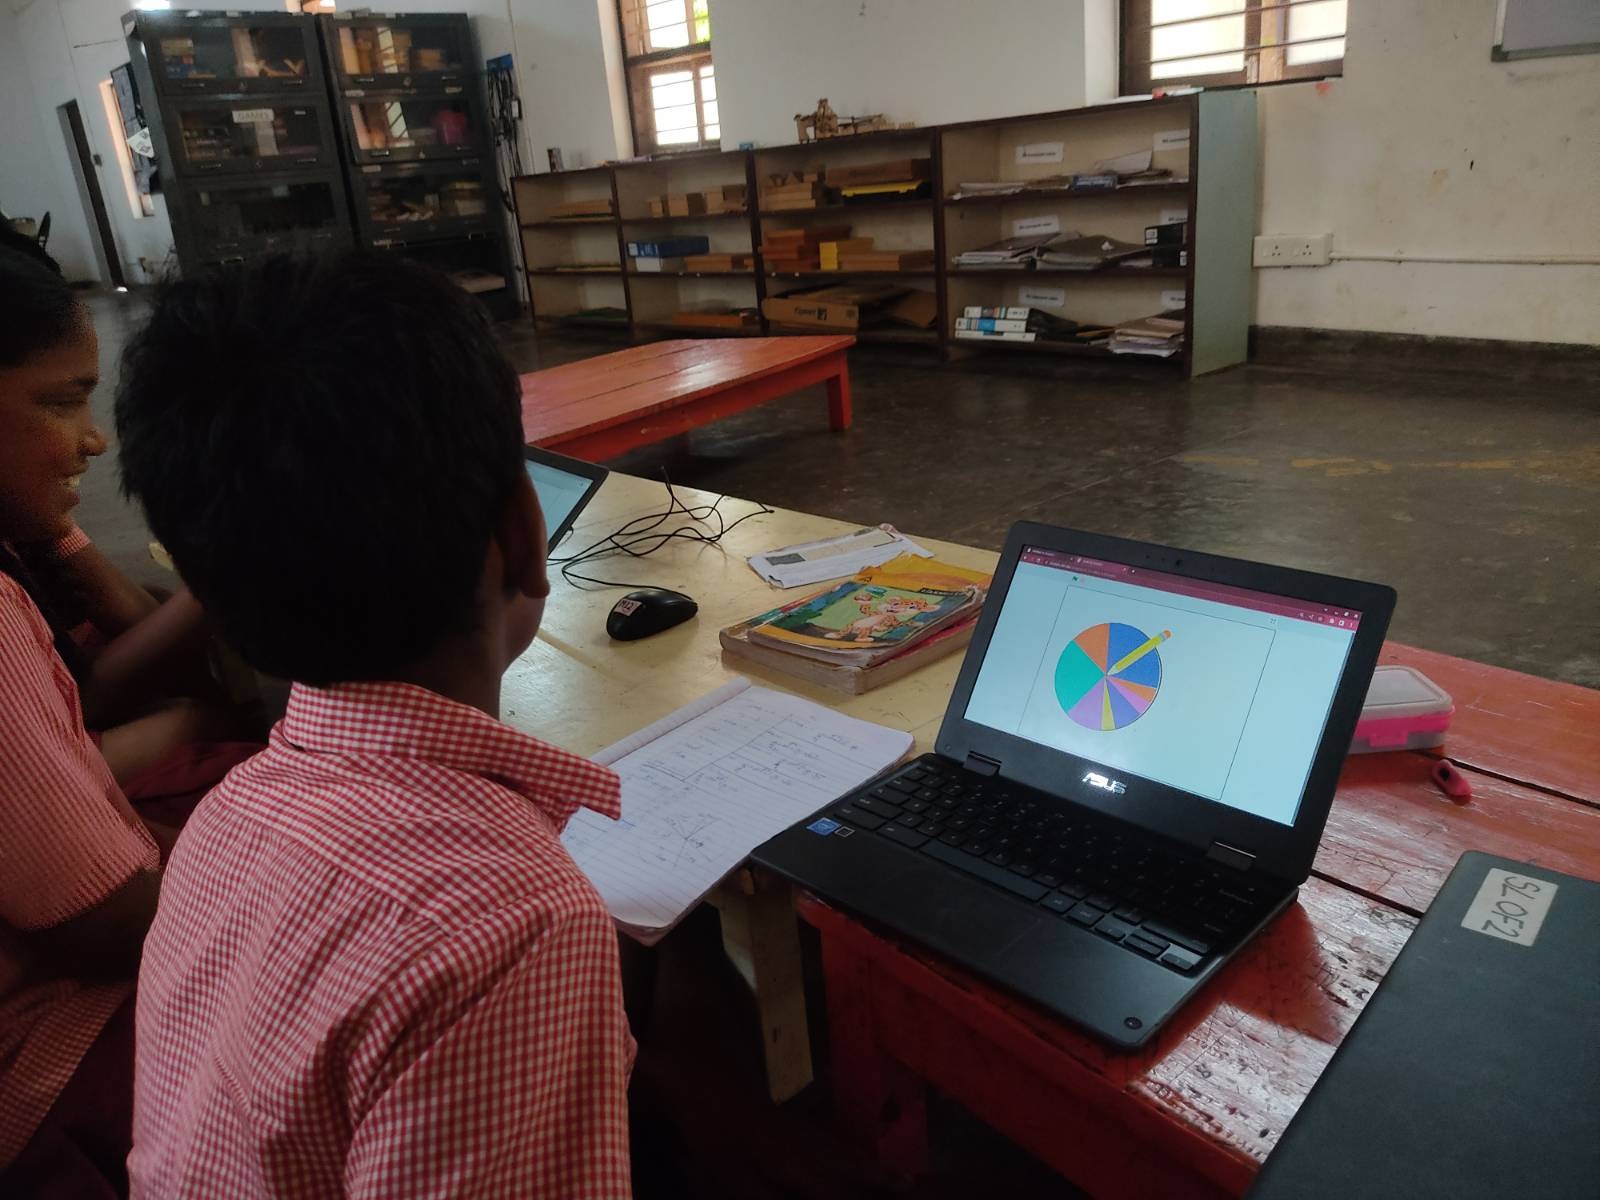
spent on each activity. They converted number of hours in degree for
each activity and plotted them in a pie chart.
Each activity was shown as a separate slice of the pie, with the size of
the slice corresponding to the time spent on that activity.
Once the pie chart was complete, students analyzed and interpreted the
data. They noticed patterns and trends in their time management, which
helped them understand their own behavior and habits better. Students were able to notice where they spend more time and realized where they need to work on.
This exercise helped 8th-grade students develop their skills in data
collection, analysis, and visualization. By engaging in this exercise,
they gained a deeper understanding of pie charts and how they can be
used to represent complex data in a simple and visual form.
Author
poovizhi@auraauro.com
Related Posts

Bhishma Hunt program
The Bhishma Hunt program, organized by Sanvi Educational and Charitable Trust at Sanvi International School, invited STEM Land to lead robotics and...
Read out all
Physical and Mental Health Awareness Session
-SandhiyaBala, Sivaguru , Tamil, Durai, Ajay, Rajesh , Gunavathi, Poovizhi , SandhiyaSaravanan and Sri Bhavani Every Tuesday morning, we have a learning...
Read out allFractions using polypod
-Ajay Children from 6th grade at Isaiambalam School learned about proper, improper and mixed fractions through stories and visualizations using Polypad. This...
Read out all
RTL session for B.Voc students
~ Jayabharathy, Poonguzhali, Tamilarasan, Sandhiya Bala, Kugan, Duraisamy, Poovizhi RTL session was conducted for the B.Voc students on 14th and 21st of...
Read out allInspiring Young Minds at Our STEAM Camp
-Mathegramming Team A five day Science Technology Engineering Arts and Maths (STEAM) Camp was organised by all the Auroville schools from 27th...
Read out all