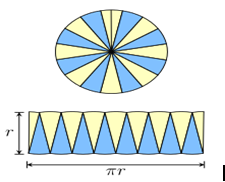
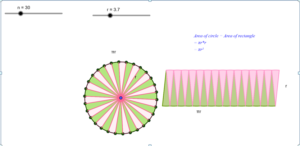
Area of the circle using the derivatives of the rectangle in GeoGebra.

Area of circle:

The area of a circle is the region covered or enclosed within its boundary. It is measured in square units. The area covered by one complete cycle of the radius of the circle on a two-dimensional plane is the area of that circle.


Area of circle formula:

Let us take a circle with a radius r from the center ‘o’ to the boundary of the circle. Then the area for this circle, A, is equal to the product of pi and the square of the radius. It is given by; 

Area of a Circle, A = πr2 square units

Here, the value of pi, π = 22/7 or 3.14, and r is the radius.

Deriving the area of the circle:

The area of a circle can be visualized & proved using two methods, namely

  • Determining the circle’s area using rectangles.
  • Determining the circle’s area using triangles.

Using the area of a rectangle:

The circle is divided into equal sectors, and the sectors are arranged as shown in fig. 3. The area of the circle will be equal to that of the parallelogram-shaped figure formed by the sectors cut out from the circle. Since the sectors have equal areas, each sector will have an equal arc length. The blue coloured sectors will contribute to half of the circumference, and the yellow-coloured sectors will contribute to the other half. If the number of sectors cut from the circle is increased, the parallelogram will eventually look like a rectangle with length equal to πr and breadth equal to r.

The area of a rectangle (A) will also be the area of a circle. So, we have

  • A = π×r×r
  • A = πr2

Let’s see the practical execution of the area of the circle using the derivatives of the rectangle in GeoGebra.

Step 1: By using a slider operation, create a number slider (n) with the following values.

  • Set Min – 1; Max- 100 and increment as 1.

Step 2: By using a slider operation, create a radius slider (r) with the following values.

  • Set Min – 4; Max- 10 and increment as 0.1.

Step 3: Plot a point A and draw a circle with radius r by keeping A as the center.

Step 4: Plot a point B anywhere on the circle.

Step 5: Give input as Rotate (B,360°/n, A).

Step 6: Now point B’ appears.

Step 7: Draw a segment between B and B’.

Step 8: Plot the midpoint C and draw a segment connecting the center and point C.

Step 9: Give the following set of inputs:

  • List1=Sequence (Rotate(B,j(360°)/n,A),j,0,n).
  • List2=Sequence (circularsector (A, Element (List1, j), Element (List1,j+1)),j,1,n,2).
  • List3=Sequence (circularsector (A, Element (List1, j), Element (List1,j+1)),j,2,n,2).
  • List4=Sequence(circularsector((jf,0), (jf+f/2,g)(jf+(-f)/2,g))),j,0,n/2-1).
  • List5=Sequence (circularsector((jf+f/2,g),(jf+0,0),(jf+f,0))),j,0,n/2-1).

Step 10: Now we can observe the sectors getting formed and listed as per the input.

Step 11: Colour the sectors accordingly and insert the text for the area of the rectangle.

Step 12: By moving the number slider we observe the desired output. i.e., Area thus formed by the sectors forms a rectangle.
https://www.geogebra.org/calculator/sczjra48

Trigonometric Functions Graph of Sin? and Cos? using GeoGebra

Trigonometry is the branch of mathematics that deals with the relationship between ratios of the sides of a right-angled triangle with its angles.

Trigonometric Functions

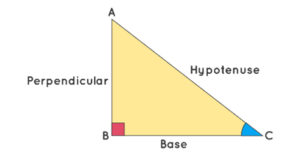
There are six basic trigonometric functions used in Trigonometry. These functions are trigonometric ratios. The six basic trigonometric functions are sine function, cosine function, secant function, co-secant function, tangent function, and co-tangent function. The trigonometric functions and identities are the ratio of sides of a right-angled triangle. The sides of a right triangle are the perpendicular side, hypotenuse, and base, which are used to calculate the sine, cosine, tangent, secant, cosecant, and cotangent values using trigonometric formulas.

Unit Circle and Trigonometric Values

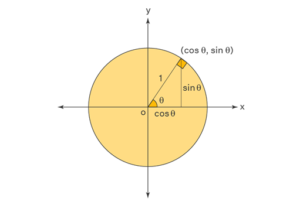
Unit circle can be used to calculate the values of basic trigonometric functions- sine, cosine, and tangent. The following diagram shows how trigonometric ratios sine and cosine can be represented in a unit circle.

Trigonometric Functions Graph

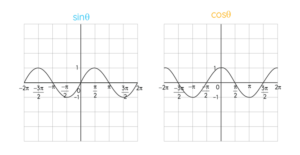
The graphs of trigonometric functions have the domain value of θ represented on the horizontal x-axis and the range value represented along the vertical y-axis. The graph of Sinθ passes through the origin and the graph of Cosθ does not pass through the origin. The range of Sinθ and Cosθ is limited to [-1, 1].

Let’s see the practical execution of the trigonometric function graphs of Sinθ and Cosθ using GeoGebra.

Steps for trigonometric function graphs of Sinθ:

  • Plot two points A and B and draw a unit circle (radius=1cm).
  • Mark a point C on the circle and measure angle BAC. Rename the angle as a.
  • Change the settings of the x-axis by giving the distance as π/2.
  • Draw a line segment between points A and C.
  • Now give the input as Segment (C, (x(C),0)).
  • A line drawn from C to the x-axis and point C changes with the angle change can be seen.
  • Now click on settings and change the line style and colour.
  • Now give input as f(x)=sin(x),0<=x<=a.
  • A sine wave has drawn as per the given range can be seen.
  • Now plot a point on the curve end D.
  • Now, to see the change between 0 degrees to 360 degrees, give the input a     Dynamic coordinate (D, a, y(C)).
  • We can see the graph is drawn for every change in angle of BAC and a sine function graph simultaneously.
  • Random point E appears along with the curve.
  • Now give the input as Segment (E, (x(E),0)).
  • Now click on settings and change the line style and colour.
  • By clicking on the animation icon, the desired output can be visualized.

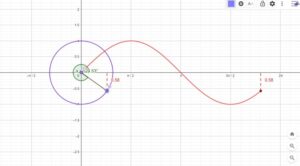
The figure shows the sine wave obtained using GeoGebra. It can be observed that the graph of Sinθ passes through the origin.

https://www.geogebra.org/classic/cdkf3rme

Steps for trigonometric function graph of Cosθ:

  • Plot two points A and B and draw a unit circle (radius=1cm).
  • Mark a point C on the circle and measure angle BAC. Rename the angle as a.
  • Change the settings of the x-axis by giving the distance as π/2.
  • Draw a line segment between points A and C.
  • Now give the input as Segment (C, (x(C),0)).
  • A line drawn from C to the x-axis and point C changes with the angle change can be seen.
  • Now click on settings and change the line style and colour.
  • Now give input as f(x)=Cos(x),0<=x<=a.
  • A sine wave has drawn as per the given range can be seen.
  • Now plot a point on the curve end D.
  • Now, to see the change between 0 degrees to 360 degrees, give the input a Dynamic coordinate (D, a, y(C)).
  • We can see the graph is drawn for every change in angle of BAC and a sine function graph simultaneously.
  • Random point E appears along with the curve.
  • Now give the input as Segment (E, (x(E),0)).
  • Now click on settings and change the line style and colour.
  • By clicking on the animation icon, the desired output can be visualized.

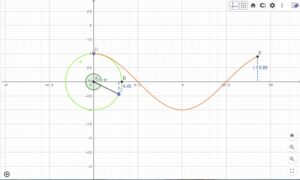
The figure shows the Cosine wave obtained using GeoGebra. It can be observed that the graph of Cosθ does not pass through the origin.

https://www.geogebra.org/classic/bcqtxcjr

Angle sum property of a triangle using GeoGebra

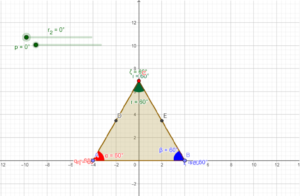
A triangle has three sides and three angles, one at each vertex. The angle sum property of a triangle states that the sum of the angles of a triangle is equal to 180º. Whether a triangle is an acute, obtuse, or a right triangle, the sum of its interior angles is always 180º.

The angle sum property of a triangle is one of the most frequently used properties in geometry. 

The angle sum property is used to find the measure of an unknown interior angle when the values of the other two angles are known.

Let’s see the practical execution of the angle sum property of the triangle using GeoGebra.

Step 1:

  • Plot two points and draw a triangle using the polygon.
  • Let’s name it ABC.
  • Now find the midpoint of AC and BC by clicking on the midpoint or center icon.
  • That midpoint is named point D. 
  • By using a slider operation, create an angle slider (r) with the following values.
    • Set Min – 0 degree; Max- 180 degrees and increment as 10 degrees.
  • Now by using rotate around point operation, click on point D and set the degree of rotation to slider r and set it as clockwise direction and click ok.


  • The same way create another slider operation for p and set the corresponding angle value as p.
  • By using the Angle measure operation measure the angles and label and colour them accordingly.
  • Give the input as the Sum of the angles and we can see the output as 180 degrees.
  • Now the slider can be moved and the angle sum property can be observed.  
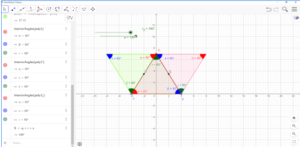
  • Even point C can be moved to observe the angle sum property for different angle combinations.

Please find the link below:

https://www.geogebra.org/classic/u6eer35p

Real-Life Example of Trigonometry

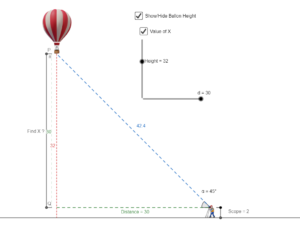
A man is standing near a Hot air balloon. He looks up at the Hot air balloon and wonders “Height of the Hot air balloon?” The height of the Hot air balloon can be found without actually measuring it. What we have here is a right-angled triangle, i.e., a triangle with one of the angles equal to 90 degrees. Trigonometric formulas can be applied to calculate the height of the Hot air balloon if the distance between the Hot air balloon and man, and the angle formed when the Hot air balloon is viewed from the ground is given


It is determined using the tangent function, such as tan of angle is equal to the ratio of the height of the Hot air balloon and the distance. Let us say the angle is θ, then

tan θ = Height/Distance between object & Hot air balloon.
Distance = Height/tan θ

Let us assume that distance is 30m and the angle formed is 45 degrees, then

Height = 30/tan 45°
Since, tan 45° = 1
So, Height = 30 m

The height of the Hot air balloon can be found out by using basic trigonometry formulas.

https://www.geogebra.org/geometry/mtuhca2s

~Prabaharan

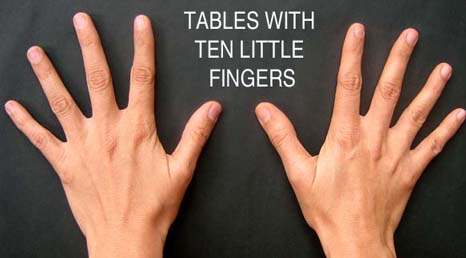
Finger multiplication for a table of 9

~saranya

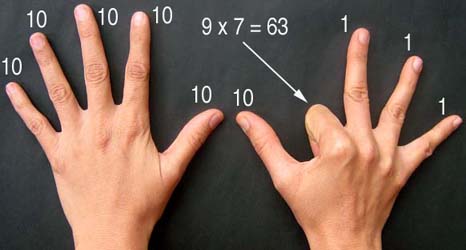
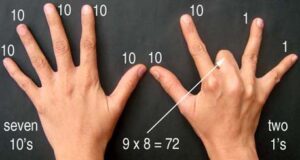
We are going to learn finger multiplication for a table of 9: Fingers

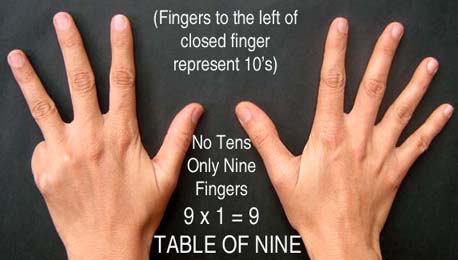
Fingers to the left of the closed finger represent 10’s and the remaining fingers 1’s.

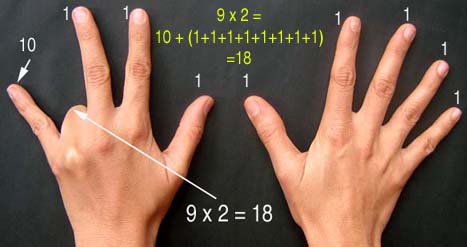
In the below picture: fingers to the left of the closed finger are 1 which means 1 ten and 8 ones are there. It represents 9×2=18.

In the below picture: fingers to the left of the closed finger are 6 which means 6 ten and 3 ones are there. It represents 9×7=63.


Similarly, fingers to the left of the closed finger are 7 which means 7 ten and 2 ones are there. It represents 9×8=72.

CROW

~ Saranya

Please refer this link  to know about “what for this blog is”

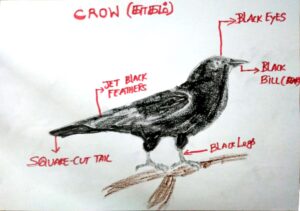
CROW


CROWS CHARACTERISTICS:

  • Males and females are almost identical.
  • Males are bigger than females.
  • Crows live in almost all parts of the world except Antarctica, the bottom part of South America, and New Zealand.

HABITAT:

  • Crows live in open spaces.
  • Agriculture fields.
  • Crows will not live in a forest or desert.

PARENTAL CARE:

  • Crows take 6 days to lay the eggs and 19 days of incubation.
  • The Male protects and gathers food. The female watches the baby birds and does not leave the nest unless to get water.
  • Both males and females work together to take care of their young.

LONGEVITY:

  • Crows will live from 6 to 7 years also crows can live up to 20 years of age in ideal condition.
  • Males and females live for the same amount of years.

SEASONAL PATTERNS:

  • When winder comes crows fly down to warmer climates.
  • During different seasons, Crows do not change their behavior

FACTS ABOUT CROW:

  • Groups of crows are called “murders”. The reason for this is that when a crow is dying of sickness, old age, or injury, the rest of the murder will often kill that crow in order to end it’s suffering.
  • Crows have the biggest brain based on body size out of all birds.
  • Crows have the ability to judge people by reading their faces and expressions.
  • Crows can imitate human voices like parrots.
  • Crows are a lot smarter than other birds.

HUMAN RELATIONSHIPS:

  • Many people think that crows are their Ancestors (people provide food to the crow).

Buzzer and LED c connection using Switch

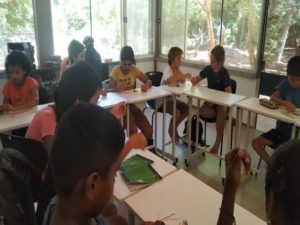
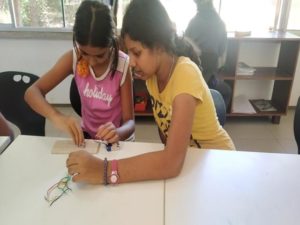
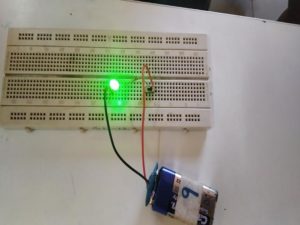
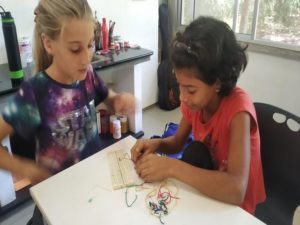
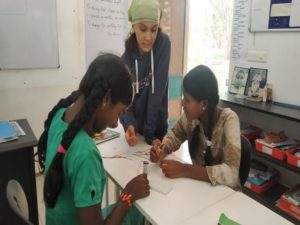
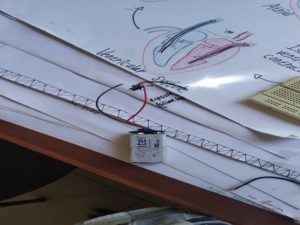
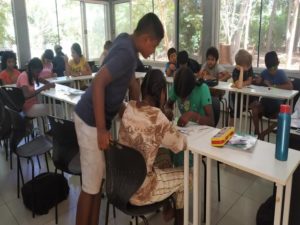
Children  in Deepanum have been learning simple electronics once in a week . They have been learning it for almost 1 and half month. There are about 15 to 20 children. In this one child  doesn’t  show interest and he would do some thing else but he wont disturb the class. All the other children work together and does something interesting. Last class we were building a circuit with switch, battery, LED and resistor. I drew the circuit diagram in the black board and asked the children to connect . All the children were able to complete the circuit on their own phase. This boy got inspired and he also started to engage in the class . He built his own circuit and  without bread board. As a teacher when I asked him to use bread board he didn’t listen to me. At that time i still my self and noticed that if in ask him to use bread board he would not do it  and the learning will stop  at that moment itself so I let him on his way and he was able to complete his circuit .  The session was so good that I realized that children are able to build the circuit on their own. I also realized that my contribution to this children growth is valuable.

Paper Glider

Murali, Arun, Madhavan

We made paper gliders with Ravi Aluganti on 29th Feb. It was easy to make and fun making them. In the end, we made a bigger one along with the children and made it fly.  Here’s a video of it.

The video also has wing model of an airplane with paper. We did this to understand the physics between the wind and the shape of the wings.


Movement Activity

~Saranya, Ranjith and Pratap

We had a session with Mrinalini on movement based activity.

1.Activity (Instruction based ):

First she asked us to walk around in the room without touching others. Next she asked us to smile when you see a person without stopping your walk. Then she asked us to turn a face when you see people in front of you (basically avoid them). Then she said  welcome everyone by one word and that word can’t be repeated. Everyone should say new word it can be anything(language was optional) (for example: object name,  welcome words,hai, hello etc….)

From that I was able to notice that how much I contribute I will received more than what I contribute.

2. Supporting activity:

She made us into few groups ans asked one person to sit in the center of their circle that person will be covered by scarf. We(person sitting in the center) need to think the scarf covered person as a snail/butterfly egg and it is suffering we(remaining people) need to help that snail/butterfly egg to get out of from suffering. Remaining people need to think of animal and they need to act like that animal without talking (need to use only sounds). Then she said everyone to start…..then she stopped us asked one question which was do you asked that snail/butterfly egg that what kind of help that need from us?….everyone said No.

In that room everyone were willing to help but without asking that question to themselves what kind of help that others need?.

3. Paper sharing:

We get into pairs and kept sheet on the floor then we(partners) kept one leg on that paper then she asked us to bring that sheet one side of the room to other side and check whether the paper is tared or not.

During this activity we were able to listen her instruction carefully and follow it also we were able to  build coordination between us etc…

These activities helps me to reflect on what I was doing. In STEMland that what’s we actually do. If children were struggling we let them struggle on their own if they can’t at that time only we step in. Then we track children progress and we knew at what levels they (each children) were there.